I. Portworx – Bringing Enterprise Storage to Kubernetes
For years, Kubernetes has become the standard platform for deploying cloud-native applications. It excels at orchestrating stateless microservices, automatically scheduling Pods, scaling workloads, and recovering from node failures. However, when organizations begin migrating mission-critical stateful applications—such as MySQL, PostgreSQL, MongoDB, Kafka, Elasticsearch, or AI vector databases—to Kubernetes, they quickly encounter a fundamental challenge:
Kubernetes orchestrates containers, but it does not solve enterprise data management.
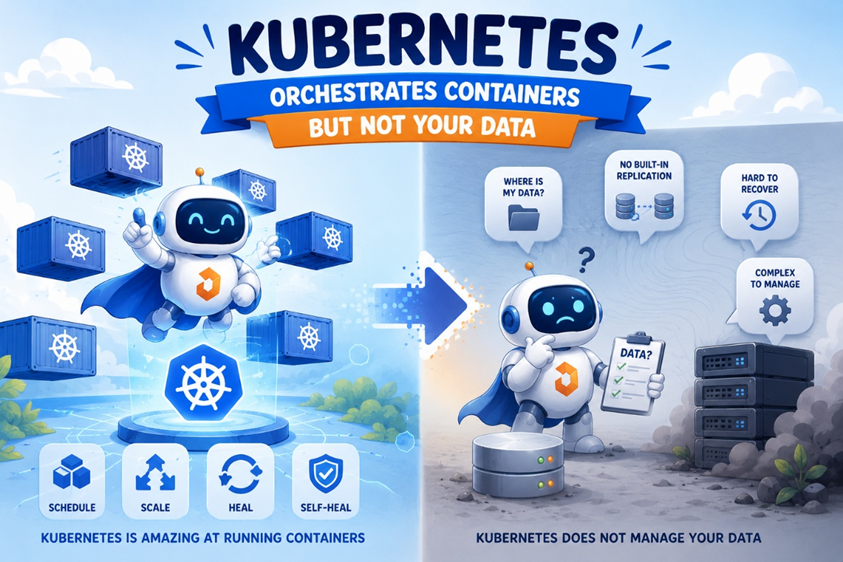
A stateless web application can be recreated anywhere in the cluster within seconds. A production database cannot.
Imagine a MySQL Pod running on Worker-02 using a Persistent Volume backed by a local disk. If Worker-02 suddenly fails, Kubernetes will reschedule the Pod onto another healthy node. Unfortunately, the data remains attached to the failed node. Although the Pod is alive again, the application cannot start because its storage is no longer accessible.
For a production banking system, an e-commerce platform, or a payment gateway, this is not merely an infrastructure issue—it is a business outage.
The real challenge is no longer how to restart a Pod, but how to ensure its data is always available regardless of where the Pod runs. This is precisely the problem that Portworx Enterprise was designed to solve.
II/More Than a Kubernetes CSI Driver
Many Kubernetes storage solutions provide a CSI (Container Storage Interface) driver that enables dynamic provisioning of Persistent Volumes. While CSI is an essential standard, it only defines how Kubernetes communicates with a storage backend. It does not define how data should be replicated, protected, migrated, backed up, or recovered.
In many environments, a CSI driver is simply a connector between Kubernetes and an external storage system:
- VMware vSphere CSI provisions volumes from a vSAN or SAN datastore.
- AWS EBS CSI provisions Amazon EBS volumes.
- Azure Disk CSI provisions Azure Managed Disks.
- NFS CSI exposes an existing NFS server.
- Local Path Provisioner allocates directories or disks on individual nodes.
These solutions are excellent at provisioning storage, but they generally rely on the underlying infrastructure to deliver high availability, replication, snapshots, and disaster recovery.
Portworx takes a fundamentally different approach.
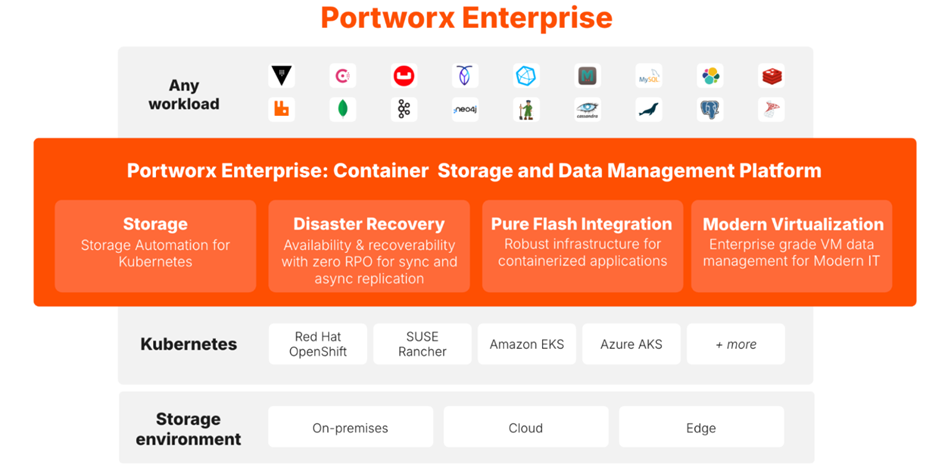
Instead of acting as a storage connector, Portworx builds a distributed storage platform directly inside the Kubernetes cluster. Every worker node contributes its available block devices—whether they are local NVMe SSDs, DAS disks, SAN LUNs, or cloud block volumes—to form a single resilient storage pool.
Applications simply request a PersistentVolumeClaim, while Portworx automatically manages:
- Data replication across multiple nodes
- Automatic volume attachment after Pod failover
- Online volume expansion
- Storage encryption
- Snapshots and cloning
- Backup and disaster recovery
- Policy-based storage automation
- Storage placement and topology awareness
To Kubernetes, it is just another StorageClass.
To enterprise applications, it behaves like a fully featured software-defined storage platform.
III/Why Enterprises Choose Portworx
As organizations modernize their infrastructure, the question is no longer whether databases can run on Kubernetes. The real question is whether they can achieve the same availability, reliability, and operational simplicity traditionally delivered by enterprise storage arrays.
Portworx addresses this requirement across a wide range of production scenarios.
1/Running Production Databases
Databases such as MySQL, PostgreSQL, MariaDB, Microsoft SQL Server, and Oracle require storage that survives Pod rescheduling, node failures, and planned maintenance.
With Portworx, each volume can be synchronously replicated across multiple Kubernetes nodes. If the node hosting the database becomes unavailable, Kubernetes automatically recreates the Pod on another worker, while Portworx immediately attaches an up-to-date replica of the volume. From the application’s perspective, the database resumes with its data intact.
2/Event Streaming Platforms
Apache Kafka, Redpanda, and Pulsar continuously write massive amounts of data to disk. Any storage disruption can lead to lengthy recovery times or degraded throughput.
Portworx minimizes recovery time by maintaining replicated copies of broker data and enabling rapid failover without requiring administrators to manually recover storage volumes.
3/Search and Analytics Platforms
Elasticsearch and OpenSearch clusters generate large indexes that continuously evolve.
As data grows, storage requirements increase unpredictably. Portworx supports online volume expansion and policy-driven automation, allowing storage to grow without interrupting indexing or search operations.
4/AI and Machine Learning Infrastructure
Modern AI platforms increasingly rely on Kubernetes to host vector databases, model repositories, and inference services.
Solutions such as Milvus, Weaviate, Qdrant, Chroma, or PostgreSQL with pgvector require persistent storage capable of handling rapidly expanding datasets while maintaining high availability.
Portworx enables these platforms to scale storage dynamically without requiring application downtime.
5/Financial Services and Banking
Banks, insurance companies, and payment providers operate applications where data availability directly impacts business continuity.
Core banking platforms, digital payment systems, fraud detection engines, and transaction processing services demand synchronous replication, encrypted storage, application-consistent snapshots, backup, and disaster recovery.
Portworx consolidates these capabilities into a Kubernetes-native platform, allowing organizations to operate stateful workloads with enterprise-grade resilience.
IV. Deploying Portworx: Building a Kubernetes-Native Storage Platform
Before we begin deploying stateful applications, we first need to transform our Kubernetes cluster into an enterprise-grade storage platform.
Unlike traditional infrastructure where storage is provided by an external SAN or NAS appliance, Portworx brings storage directly into Kubernetes. By pooling storage devices from multiple worker nodes, it creates a distributed software-defined storage layer capable of delivering high availability, automatic failover, replication, snapshots, and dynamic volume provisioning—all managed natively through Kubernetes.
In this section, we’ll deploy Portworx Enterprise on our Kubernetes cluster and build the storage foundation that will power every StatefulSet throughout the remainder of this lab.
Lab Environment
The demonstration environment is intentionally kept compact while preserving the operational architecture commonly found in production environments.
The Kubernetes cluster was provisioned using Kubespray, featuring a dedicated control plane node (master-01) and four worker nodes (worker-01, worker-02, worker-03, and worker-04).
| Node | Role | Portworx | Data Disk |
| master-01 | Control Plane | No | — |
| worker-01 | Worker | Yes | /dev/sdb (32 GB) |
| worker-02 | Worker | Yes | /dev/sdb (32 GB) |
| worker-03 | Worker | Yes | /dev/sdb (32 GB) |
| worker-04 | Worker | Yes | /dev/sdb (32 GB) |
Each worker node includes an additional 32 GB block device (/dev/sdb) reserved exclusively for Portworx. The disk remains unformatted and unmounted because Portworx requires direct access to raw block storage in order to manage storage pools efficiently.
Although this lab uses Direct Attached Storage (DAS) for simplicity, the deployment model remains identical in production environments where storage may originate from SAN LUNs, Fibre Channel, iSCSI, NVMe devices, or cloud block storage services such as Amazon EBS, Azure Managed Disks, or Google Persistent Disks. The objective of this lab is not to demonstrate a specific storage technology, but rather to illustrate how Portworx abstracts physical storage into a resilient, Kubernetes-native data platform.
STORK: Intelligent Storage-Aware Scheduling for Stateful Applications
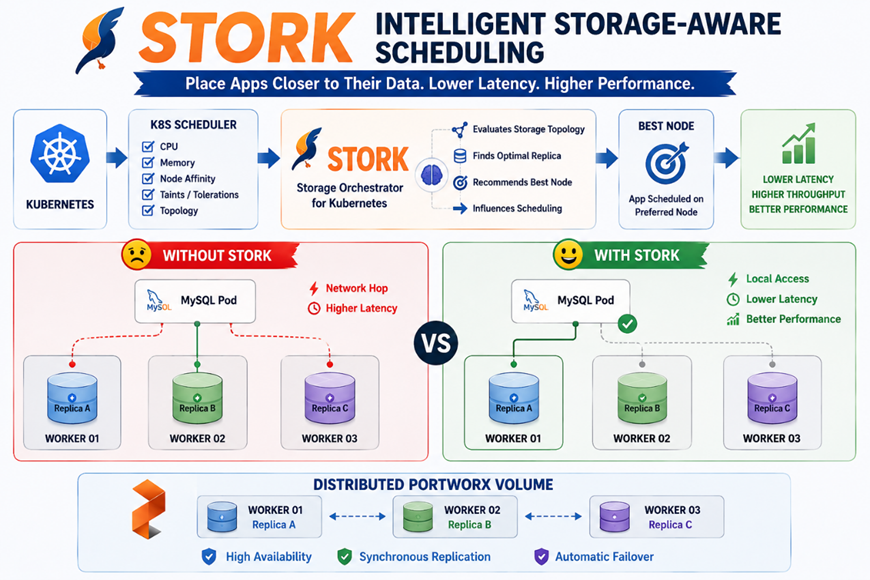
One of Portworx’s most distinctive capabilities extends beyond storage itself. It is STORK (Storage Orchestrator for Kubernetes)—an intelligent scheduling component designed specifically for stateful workloads.
In a standard Kubernetes cluster, the default scheduler makes placement decisions primarily based on compute resources such as CPU, memory, node affinity, taints, tolerations, and topology constraints. While this approach works well for stateless applications, it does not always produce the most efficient placement for workloads whose performance depends heavily on local data access.
Consider a MySQL database whose Portworx volume has replicas distributed across three worker nodes. If Kubernetes schedules the database Pod onto a node that does not host the preferred replica, every I/O operation may need to traverse the cluster network before reaching the storage backend. Although the application continues to function correctly, this additional network hop introduces unnecessary latency and consumes network bandwidth.
STORK addresses this challenge by making Kubernetes storage-aware.
Instead of allowing Pods to be scheduled without considering where their data resides, STORK continuously evaluates the topology of Portworx volumes and influences the scheduling process so that stateful applications are preferentially placed on nodes that already contain a healthy local replica of their Persistent Volume.
Rather than moving data to the application, STORK intelligently moves the application closer to its data.
This optimization significantly reduces storage latency while improving overall application performance, particularly for I/O-intensive workloads such as relational databases, Kafka clusters, Elasticsearch, and AI vector databases.
Step 1: Prepare and Label the Worker Nodes
Before installing anything, we need to declare our node topology using standard Kubernetes labels and ensure the OS prerequisites are met.
1. Label the Worker Nodes
Assign the storage label to the three nodes hosting our /dev/sdd drives:
kubectl label node worker-01 worker-02 worker-03 worker-04 portworx.io/node-type=storage
Step 2: Generate the Portworx Specification
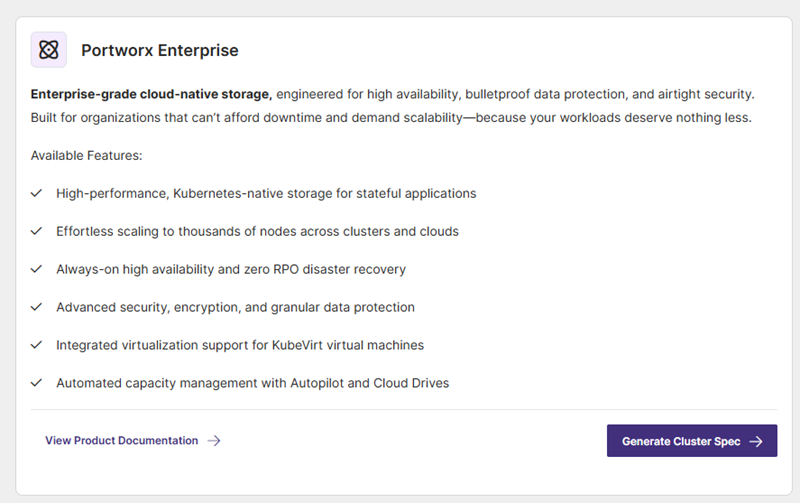
Rather than writing the complex StorageCluster CRD manifest completely from scratch, Portworx provides Portworx Central—an interactive specification generator that tailors the deployment manifest to your specific infrastructure, network topology, and storage requirements.
Here is how to generate the spec for our bare-metal Kubernetes lab environment:
1. Navigate to Portworx Central
- Sign in to Portworx Central: https://central.portworx.com/
- From the welcome screen, navigate to Portworx Enterprise and select Generate Cluster Spec.
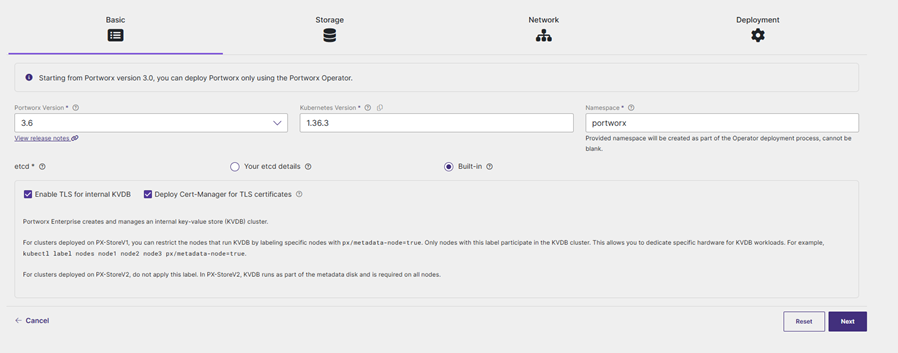
2. Basic Configuration Tab
Navigate to Portworx Central, select Portworx Enterprise, and click Generate Cluster Spec.
- Portworx Version: Select the latest stable release
- Platform: Select DAS/SAN (Direct-Attached Storage / Storage Area Network).
- Distribution Name: Select None (for standard vanilla Kubernetes or Kubespray).
Production Note: If you are running OpenShift, RKE2, Anthos, or TKGI, select your specific distribution here so Portworx applies the required Security Context Constraints (SCC) and RBAC policies automatically.
- Key-Value Store (KVDB): Select Built-in. This tells Portworx to run its own internal, highly available metadata database rather than requiring an external etcd cluster. Keep TLS enabled by default.
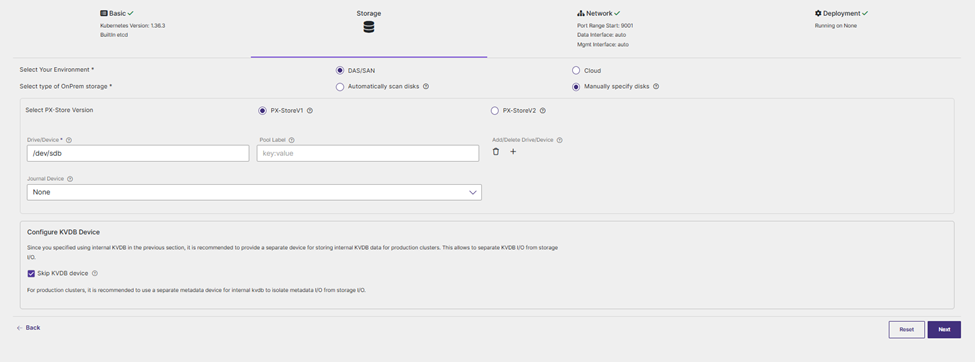
3. Storage Configuration Tab
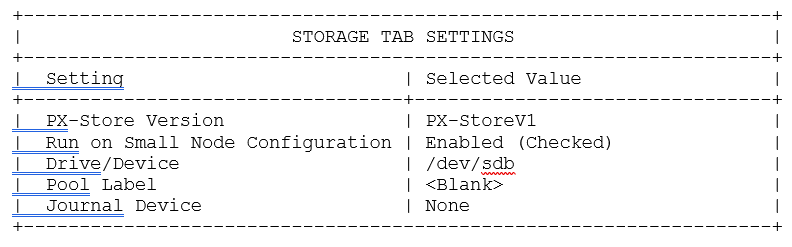
This tab defines how Portworx discovers and interacts with your physical storage devices.
Why these choices matter:
- PX-Store Version (
PX-StoreV1):
We explicitly select PX-StoreV1. While PX-StoreV2 offers newer storage architecture features, it strictly mandates a dedicated Metadata Path with at least 64 GB of pre-provisioned space. Because our lab nodes utilize 32 GB disks (/dev/sdb), selecting PX-StoreV1 removes this 64 GB constraint and allows Portworx to initialize seamlessly.
- Run on Small Node Configuration:
Checked. Portworx Enterprise recommends at least 8 CPU cores and 8 GB RAM per node by default. Enabling this toggle allows the storage pods to run with a lighter resource footprint, which is ideal for lab virtual machines.
- Drive/Device (
/dev/sdd):
Enter /dev/sdd. This targets the raw, unformatted 32 GB block device attached to each of our storage worker nodes.
- Journal Device (
None):
Set to None. In high-throughput production environments, you can assign dedicated NVMe devices for journaling to accelerate write operations. For standard workloads, the default internal journaling is sufficient.
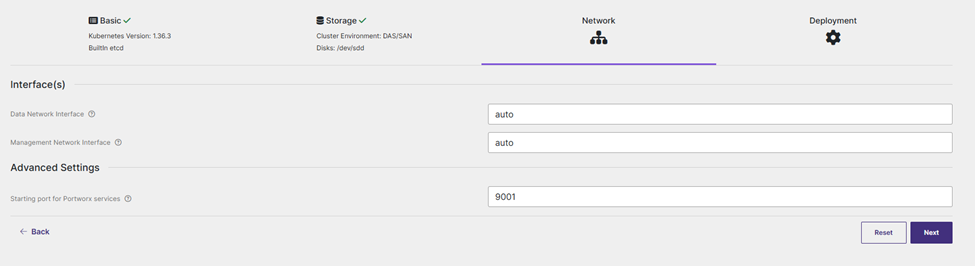
4. Network Configuration Tab
This tab configures how storage data replication and management communications flow across your physical network interfaces.
- Data Network Interface (
auto):
Portworx automatically detects the active primary network interface (e.g., eth0 or ens192) used by Kubernetes.
Enterprise Tip: In high-performance enterprise deployments, you should separate management traffic from data traffic. You can specify a dedicated 10GbE/25GbE interface (e.g., eth1) strictly for storage replication traffic to prevent data transfers from saturating your primary application network.
- Management Network Interface (
auto):
Defaults to auto to share the primary control plane interface for health checks and API calls.
- Starting Port (
9001):
The default base port for internal Portworx services (range 9001–9022). Keep default unless you have local port conflicts.
5. Deployment Configuration Tab
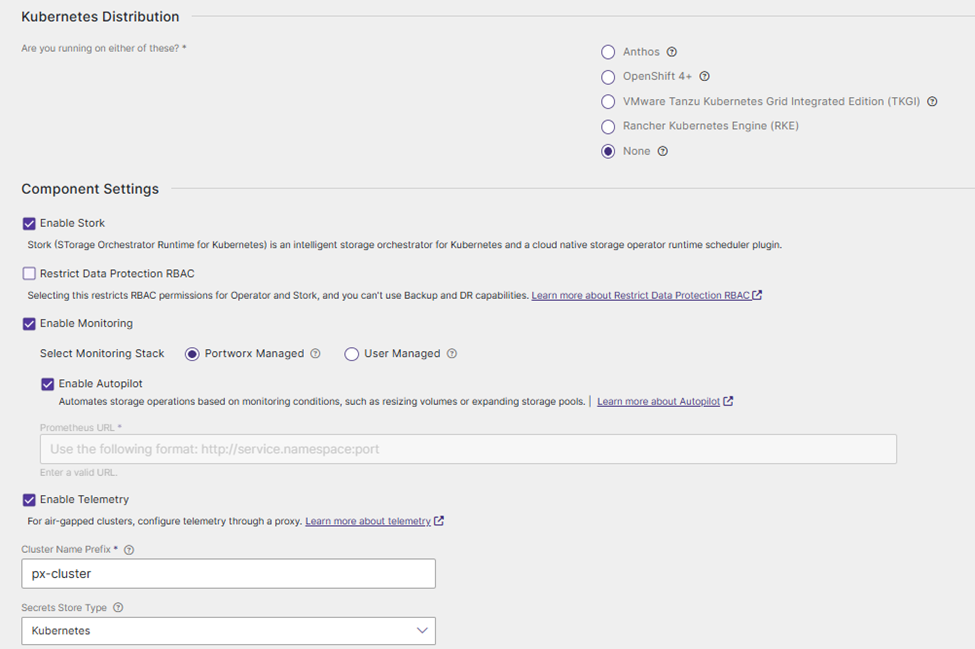
The final tab enables core engine components, monitoring stacks, and cluster parameters.
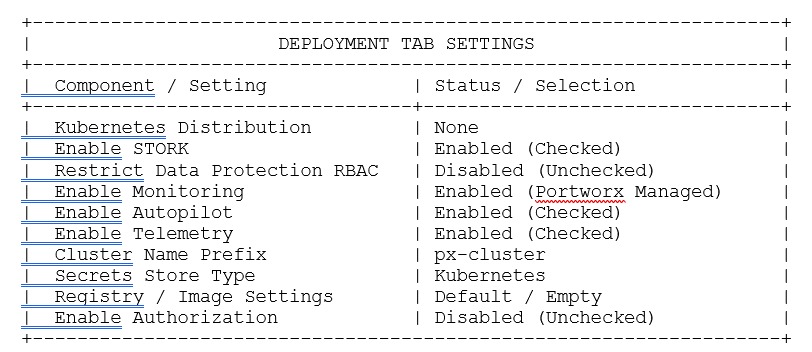
Key Component Breakdown:
- Enable STORK:
Must remain checked. STORK (Storage Orchestrator Runtime for Kubernetes) bridges the gap between Kubernetes pod scheduling and Portworx volume location, ensuring pods are placed on nodes hosting local data replicas.
- Enable Monitoring (
Portworx Managed):
Selecting Portworx Managed deploys an internal, isolated Prometheus stack managed automatically by the operator. This provides real-time metrics out of the box without requiring pre-existing cluster monitoring.
- Enable Autopilot:
Checked. Activates the PX-Autopilot engine, allowing us to define automated scaling rules (such as expanding PVC size when usage crosses 80%).
- Secrets Store Type (
Kubernetes):
Uses native Kubernetes Secrets to store cluster encryption keys and credentials for snapshot targets (like AWS S3 or MinIO).
- Enable Authorization (Disabled for Lab):
Left unchecked for this deployment. Disabling strict API authorization avoids the need to manage security tokens when executing administrative troubleshooting commands via pxctl.
6. Save and Download
Click Finish, assign a spec name (e.g., px-baremetal-spec), and click Save & Download. Portworx Central will generate your customized portworx-cluster.yaml file, ready to be applied directly to your cluster.
Step 3: Deploy the Portworx Operator & StorageCluster
With our custom specification generated and downloaded, we are ready to install Portworx onto our Kubernetes cluster.
The deployment follows a standard Kubernetes Operator pattern executed in two phases:
- Deploy the Portworx Operator: Registers the necessary CustomResourceDefinitions (CRDs) and starts the operator controller pod.
- Apply the
StorageClusterManifest: Instructs the operator to initialize the storage engine, pool/dev/sddblock devices, and configure cluster services.
1. Deploy the Portworx Operator
The Portworx Operator manages the full deployment lifecycle, automated reconciliation, and updates for your storage fabric.
Run the following command using the version tag targeted during your spec generation (e.g., 3.6):
kubectl apply -f 'https://install.portworx.com/3.6?comp=pxoperator&kbver=1.36.3&ns=portworx'
Pro Tip: Always verify that the Operator pod is up and running before applying your custom resource. This ensures that all required CRDs (such as StorageCluster) are fully registered in the Kubernetes API server.
Check the operator status in the portworx namespace:
kubectl get pods -n portworx -l name=portworx-operator
2. Apply the Generated StorageCluster Manifest
Now that the operator is listening, apply the customized portworx-cluster.yaml manifest you saved from Portworx Central in Step 2:
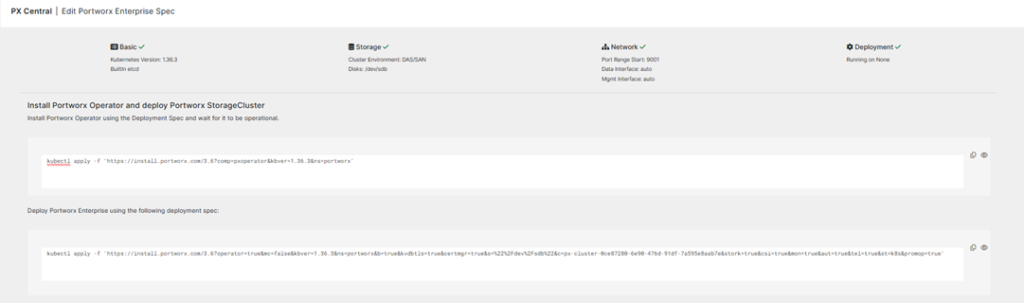
kubectl apply -f 'https://install.portworx.com/3.6?operator=true&mc=false&kbver=1.36.3&ns=portworx&b=true&kvdbtls=true&certmgr=true&s=%22%2Fdev%2Fsdb%22&c=px-cluster-0ce87280-6e90-476d-91df-7a595e8aab7e&stork=true&csi=true&mon=true&aut=true&tel=true&st=k8s&promop=true'
Tracking Cluster Initialization to Online State
Once the Portworx Operator accepts the specification, it registers the StorageCluster Custom Resource Definition (CRD) and begins bootstrapping the storage engine across all designated worker nodes (worker-01 through worker-04).
To monitor the high-level deployment status, query the StorageCluster resource within the portworx namespace:
kubectl get StorageCluster -n portworxDuring the first few minutes of deployment, you will observe the cluster status transition to Initializing:

Once all four worker nodes format their local /dev/sdb drives, join the internal KVDB quorum, and pass health checks, the STATUS column transitions from Initializing to Running:

Step 4: Monitor Node Initialization & Cluster Health
Once you apply the StorageCluster manifest, Portworx begins initializing components across all target worker nodes. Rather than forcing you to shell into individual nodes, Portworx exposes native Kubernetes Custom Resources called StorageNode objects.
This allows you to inspect cluster initialization and troubleshoot storage health directly through standard kubectl workflows.
1. Monitor StorageNode Operational Status
To track the high-level rollout progress across all nodes, query the storagenodes resource in your Portworx namespace (portworx):
kubectl -n portworx get storagenodes -l name=portworx
2. Verify Portworx Pod Status
While checking the high-level StorageCluster CRD confirms overall operational health, verifying individual pod statuses provides granular visibility into how the Portworx DaemonSet is scheduled across your worker nodes (worker-01 through worker-04).
Enter the following command to list and filter the results for Portworx pods within the portworx namespace:
kubectl get pods -n portworx -o wide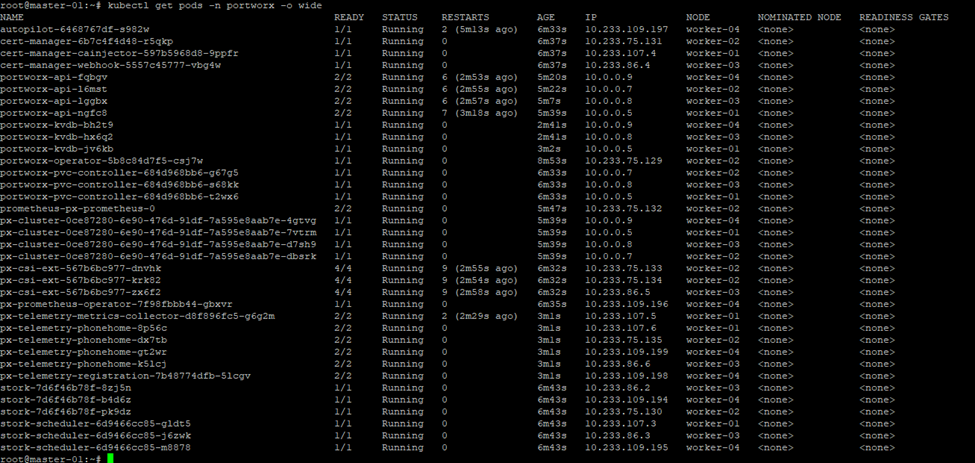
3. Verify Portworx Cluster Status
While checking pod status confirms that the daemon containers are running, evaluating the internal health of the distributed storage fabric requires querying Portworx directly via its CLI tool: pxctl.
kubectl exec <pod-name> -n <px-namespace> -- /opt/pwx/bin/pxctl status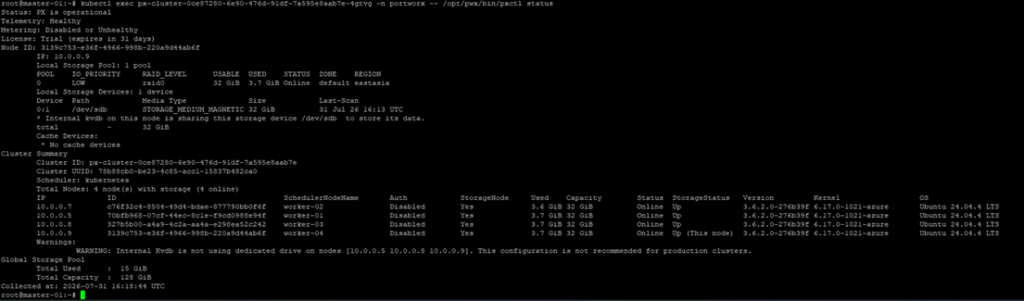
· Status: PX is operational: The storage fabric on the local target node (worker-04 at 10.0.0.9) has initialized successfully and connected to all peer nodes in the mesh.
· License: Trial (expires in 31 days): Portworx is running on an unrestricted 30-day Enterprise trial tier.
· Total Capacity: 128 GiB (aggregated across 4 nodes × 32 GiB per drive).
· Total Used: 15 GiB (includes KVDB internal state replication, volume metadata, and system pools).
· Why this warning appears: In this single-disk lab setup (/dev/sdb), Portworx shares the main storage device with its internal key-value database (KVDB) to store cluster metadata.
· Production Recommendation: For production enterprise workloads, Portworx recommends adding a dedicated small, high-speed drive (e.g., a 10–20 GB SSD/NVMe device like /dev/sdc) specifically for KVDB to ensure metadata operations remain completely isolated from application storage I/O bottlenecks.V. Deploying a Highly Available Stateful MySQL Application with Portworx
V. Deploying a Highly Available Stateful MySQL Application with Portworx
V.1 Out-of-the-Box Portworx StorageClasses & Real-World Usage
When Portworx is deployed via the operator, it automatically registers a set of pre-configured, production-ready StorageClasses. This eliminates the need to manually define custom storage classes for standard enterprise workloads.
Checking the cluster’s available StorageClasses reveals several built-in profiles:
When Portworx is deployed via the operator, it automatically registers a set of pre-configured, production-ready StorageClasses. This eliminates the need to manually define custom storage classes for standard enterprise workloads. Checking the cluster’s available StorageClasses reveals several built-in profiles:

Overview of Key Default StorageClasses
px-csi-db(Selected for Demo): Pre-tuned specifically for transactional databases (MySQL, PostgreSQL). It applies database-level I/O optimization (io_profile: "db"), high I/O priority, and synchronous multi-node replication.px-csi-replicated: A general-purpose replicated storage class ideal for generic stateful workloads requiring high availability.px-csi-db-cloud-snapshot/px-csi-db-local-snapshot: Built-in classes integrated with Portworx STORK to handle automatic cloud (S3/Azure Blob) or local volume snapshot schedules.*-encryptedVariants: Pre-configured with envelope encryption hooks for compliance-heavy environments (PCI-DSS, HIPAA).
V.2 Provisioning the PersistentVolumeClaim (PVC)
Rather than creating a custom manifest, we will directly claim storage using the pre-existing px-csi-db StorageClass.
Step 1: Create the mysql-pvc.yaml Manifest
Execute the following command on master-01 to provision a 10 GiB PVC bound to px-csi-db:
cat <<EOF | kubectl apply -f -
apiVersion: v1
kind: PersistentVolumeClaim
metadata:
  name: mysql-pvc
  namespace: default
spec:
  storageClassName: px-csi-db
  accessModes:
    - ReadWriteOnce
  resources:
    requests:
      storage: 10Gi
EOF
Step 2: Verify PVC Binding
Check that Portworx has dynamically bound the requested volume:
kubectl get pvc mysql-pvc -n default
V.3 Deploying the Stateful MySQL Application
Deploy a single-replica MySQL 8.0 StatefulSet that mounts mysql-pvc to /var/lib/mysql. Step 1: Apply the Service and StatefulSet Manifests
Step 1: Apply the Service and StatefulSet Manifests
cat <<EOF | kubectl apply -f -
apiVersion: v1
kind: Service
metadata:
  name: mysql
  namespace: default
  labels:
    app: mysql
spec:
  ports:
    - port: 3306
      name: mysql
  clusterIP: None
  selector:
    app: mysql
---
apiVersion: apps/v1
kind: StatefulSet
metadata:
  name: mysql
  namespace: default
spec:
  selector:
    matchLabels:
      app: mysql
  serviceName: mysql
  replicas: 1
  template:
    metadata:
      labels:
        app: mysql
    spec:
      containers:
        - image: mysql:8.0
          name: mysql
          env:
            - name: MYSQL_ROOT_PASSWORD
              value: "Portworx@2026"
            - name: MYSQL_DATABASE
              value: "production_db"
          ports:
            - containerPort: 3306
              name: mysql
          volumeMounts:
            - name: mysql-persistent-storage
              mountPath: /var/lib/mysql
      volumes:
        - name: mysql-persistent-storage
          persistentVolumeClaim:
            claimName: mysql-pvc
EOF
Step 2: Identify the Active Worker Host
Check which worker node is hosting the newly created mysql-0 pod:
kubectl get pods -l app=mysql -o wide
📌 Take Note: The mysql-0 pod is currently executing on worker-03.
V.4 Seeding Production Test Data
Connect to the running MySQL instance, construct a schema, and insert sample order transactions.
Step 1: Open MySQL CLI Inside the Container
kubectl exec -it mysql-0 -n default -- mysql -u root -pPortworx@2026 production_db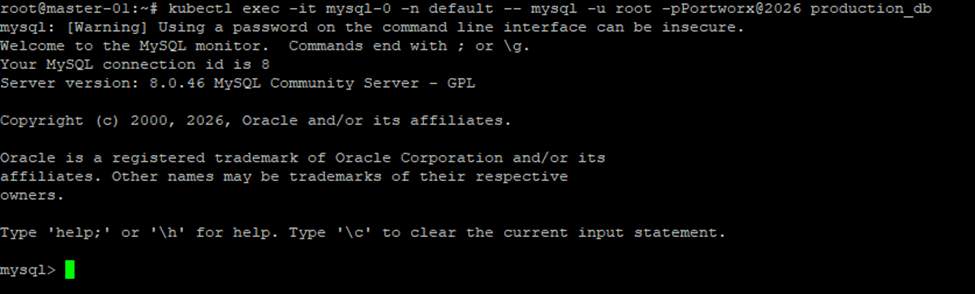
Step 2: Execute SQL Data Seeding Commands
Paste the following SQL statements directly into the prompt:
-- 1. Create orders table
CREATE TABLE orders (
    order_id INT AUTO_INCREMENT PRIMARY KEY,
    customer_name VARCHAR(100) NOT NULL,
    product_name VARCHAR(100) NOT NULL,
    amount DECIMAL(10, 2) NOT NULL,
    created_at TIMESTAMP DEFAULT CURRENT_TIMESTAMP
);

-- 2. Insert test transaction records
INSERT INTO orders (customer_name, product_name, amount) VALUES
('Nguyen Van A', 'Portworx Enterprise License', 1500.00),
('Tran Thi B', 'Kubernetes Managed Cluster', 2400.50),
('Le Van C', 'Cloud Block Storage Drive', 350.00);

-- 3. Query records
SELECT * FROM orders;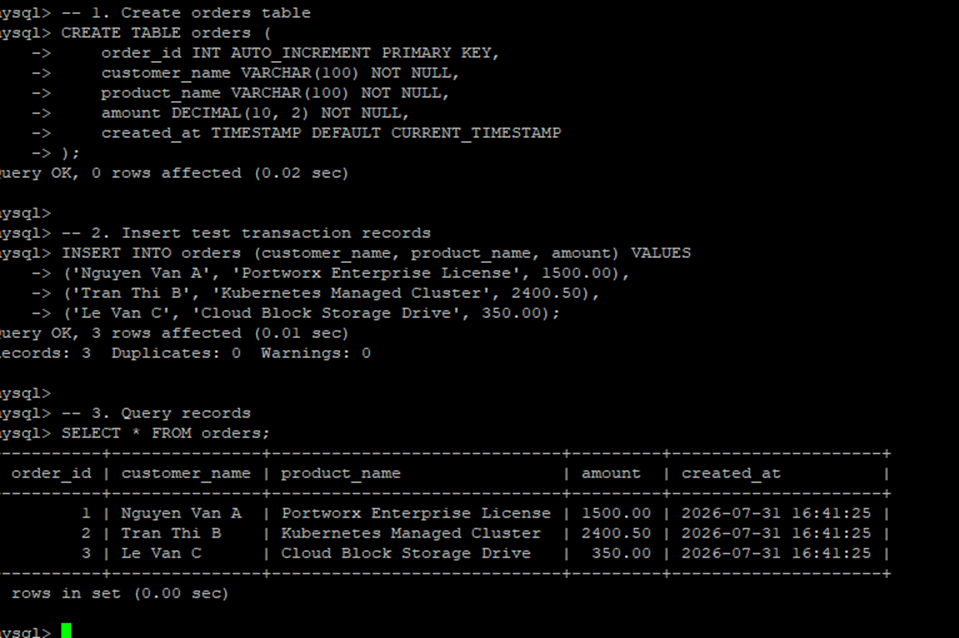
V.5 Simulating Node Failure (Hard Shutdown)
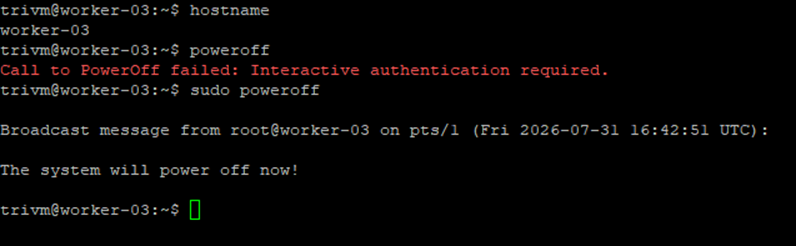
Step 1: Power Off worker-03
To test Portworx volume replication and automatic failover, simulate a physical server crash by powering off worker-03.
Step 2: Observe Kubernetes & Portworx Failover
From master-01, monitor the pod rescheduling progress:
kubectl get pods -l app=mysql -o wide -w
⚡ Failover Result: The mysql-0 pod successfully transitioned to 1/1 Running on worker-01. Portworx automatically detached the volume from the dead node and attached the synchronized local replica on worker-01.
V.6 Verifying Data Integrity Post-Failover
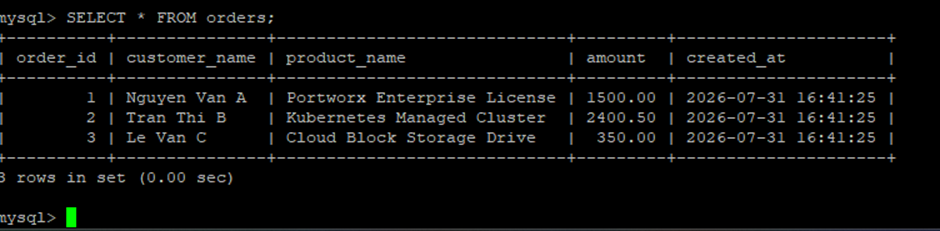
Connect to the rescheduled MySQL pod on worker-02 and query the table to verify zero data loss.
Step 1: Re-enter MySQL CLI on the New Node
kubectl exec -it mysql-0 -n default -- mysql -u root -pPortworx@2026 production_db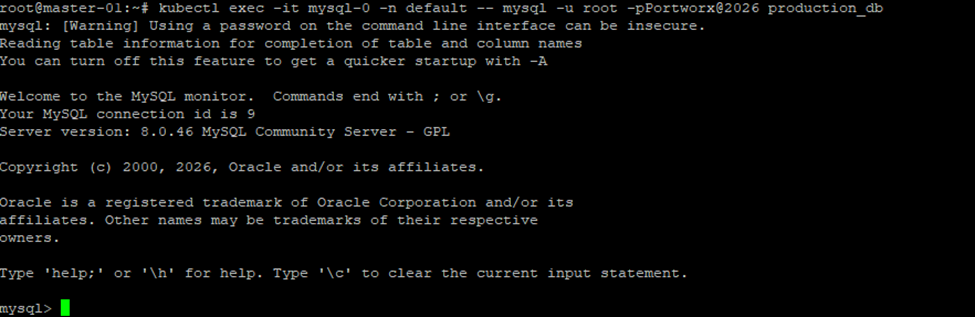
Step 2: Execute Query
SELECT * FROM orders;
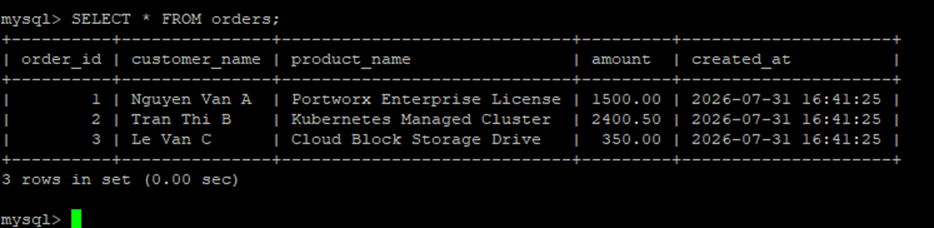
🎯 Success: All 3 records remain intact. The application suffered zero data loss (RPO = 0).
V.7 Technical Conclusion: How Portworx Protects Stateful Workloads
This failover demonstration highlights the core architectural benefits of Portworx:
- Out-of-the-Box DB Tuning (
px-csi-db): Using the defaultpx-csi-dbStorageClass automatically applies database-optimized I/O parameters (io_profile: "db") and multi-node synchronous volume replication without requiring custom configurations. - Per-Volume Synchronous Block Replication: Data written to
/var/lib/mysqlis mirrored at the volume level across Portworx storage pools (backed by/dev/sdbon participating worker nodes) in real time before write acknowledgments are returned to the application. - Hyper-Converged Data Locality & Instant Failover: When
worker-01failed, Portworx instantly attached the existing volume replica onworker-02to the rescheduled pod. This reduces Recovery Time Objective (RTO) to seconds while eliminating cloud disk detachment bottlenecks
VI. Automated Storage Scaling with Portworx Autopilot
VI.1 Real-World Application & Enterprise Context
In production environments, one of the most common causes of database outages is disk exhaustion. When a database like MySQL runs out of storage space on its underlying volume, the database engine usually crashes abruptly, leading to transaction rollbacks, lockfile corruption, and extended service downtime.
Traditionally, addressing storage growth required manual operational effort:
- Monitoring alerts notify engineers that a disk is reaching capacity (e.g., 80% full).
- Engineers manually edit the PVC size or request a storage extension.
- In legacy setups, this often required scheduling maintenance windows to unmount volumes or restart pods.
Portworx Autopilot solves this problem by bringing rule-based, automated storage capacity expansion to Kubernetes. Autopilot continuously monitors volume metrics and automatically resizes persistent volumes in real time when predefined utilization thresholds are breached—without restarting the application pod or interrupting database operations.
VI.2 Defining the Autopilot Rule for MySQL
We will deploy an AutopilotRule Custom Resource to continuously monitor mysql-pvc.
Scaling Logic:
- Condition: When disk usage exceeds 50% of the total provisioned capacity.
- Action: Automatically expand the volume capacity by 100% (e.g., from 10 GiB to 20 GiB).
Step 1: Label the Existing PVC
First, attach a label to our existing mysql-pvc so Autopilot can target it specifically:
kubectl label pvc mysql-pvc app=mysql -n defaultStep 2: Apply the AutopilotRule Manifest
Autopilot Policy Logic
- Target Selector: Any PVC labeled
app=mysql. - Condition: Trigger when volume usage (
px_volume_usage_percent) exceeds 50%. - Action: Automatically expand the volume capacity by 50% (scaling
mysql-pvcfrom 10 GiB to 15 GiB).
Run the following command on master-01 to register the scaling policy:
cat <<EOF | kubectl apply -f -
apiVersion: autopilot.libopenstorage.org/v1alpha1
kind: AutopilotRule
metadata:
  name: volume-resize
spec:
  ##### selector filters the objects affected by this rule given labels
  selector:
    matchLabels:
      app: mysql
  ##### conditions are the symptoms to evaluate. All conditions are AND'ed
  conditions:
    # volume usage should be less than 50%
    expressions:
    - key: "100 * (px_volume_fs_usage_bytes / px_volume_capacity_bytes)"
      operator: Gt
      values:
        - "50"
  ##### action to perform when condition is true
  actions:
  - name: openstorage.io.action.volume/resize
    params:
      # resize volume by scalepercentage of current size
      scalepercentage: "100"
      # volume capacity should not exceed 100GiB
      maxsize: "100Gi"
EOF
Step 3: Verify Autopilot Rule Status
Confirm that Autopilot has accepted the rule and is actively evaluating metrics:
kubectl get autopilotrule mysql-auto-expand-rule -o wide
VI.3 Simulating High Storage Consumption
Currently, mysql-pvc has 10 GiB of allocated capacity with minimal data used. To trigger Autopilot, we will write synthetic data into MySQL to push disk utilization beyond the 50% (5 GiB) threshold.
Step 1: Populate MySQL with Stress Test Data
Run the following SQL generation loop inside the mysql-0 pod:
kubectl exec -it mysql-0 -n default -- mysql -u root -pPortworx@2026 production_db -e "
CREATE TABLE IF NOT EXISTS stress_data (
    id INT AUTO_INCREMENT PRIMARY KEY,
    payload LONGTEXT
);
SET @dummy = REPEAT('PortworxAutopilotAutoExpansionDemoBlogTechNoStressCloud', 100000);
INSERT INTO stress_data (payload) VALUES (@dummy);
INSERT INTO stress_data (payload) SELECT payload FROM stress_data;
INSERT INTO stress_data (payload) SELECT payload FROM stress_data;
INSERT INTO stress_data (payload) SELECT payload FROM stress_data;
INSERT INTO stress_data (payload) SELECT payload FROM stress_data;
INSERT INTO stress_data (payload) SELECT payload FROM stress_data;
INSERT INTO stress_data (payload) SELECT payload FROM stress_data;
"
Step 2: Check Disk Utilization Inside the Pod
Check the mounted /var/lib/mysql filesystem size:
kubectl exec -it mysql-0 -n default -- df -h /var/lib/mysql
⚡ Threshold Triggered: Utilization has reached 57%, crossing our configured 50% rule condition.
VI.4 Observing Automated Volume Expansion
Once the usage threshold is breached, Portworx Autopilot automatically triggers the expansion workflow without human intervention.
Step 1: Track Rule Execution & Events
Monitor how Autopilot progresses through its lifecycle states:
kubectl get events --field-selector involvedObject.kind=AutopilotRule,involvedObject.name=volume-resize --all-namespaces --sort-by .lastTimestamp
Step 3: Verify Online Filesystem Resizing Inside Container
Check the mounted mount point inside mysql-0 to confirm that the block device and filesystem scaled online (100% to 20GB):
kubectl exec -it mysql-0 -n default -- df -h /var/lib/mysql

VI.5 Key Takeaways & Enterprise Benefits of Portworx Autopilot
- Metric-Driven Telemetry via Prometheus: Autopilot evaluates real-time storage telemetry directly from Prometheus (
px_volume_usage_percent) at the block storage layer rather than relying on reactive application checks or manualdfoutput. This ensures deterministic, rule-based scaling before disk saturation occurs. - Zero-Downtime Online Resizing: Volume expansion is performed entirely online via the Portworx CSI driver (
pxd.portworx.com). Autopilot resizes the underlying block device and extends the container filesystem (ext4/xfs) in real time, requiring zero pod restarts, no unmounting, and no database downtime. - Proactive Outage & Corruption Prevention: Unexpected disk exhaustion is a leading cause of database crashes, lockfile corruption, and failed write transactions. Autopilot automatically resolves capacity bottlenecks before volumes hit 100% capacity, maintaining strict SLA guarantees for stateful workloads.
- Just-In-Time Storage Provisioning & Cost Optimization: Enterprise teams no longer need to over-provision massive storage volumes upfront to account for future growth. Persistent volumes can start with minimal capacity (e.g., 10 GiB) and scale dynamically as data expands, drastically reducing unnecessary cloud storage expenditure.
- Policy-Driven Infrastructure Automation: By leveraging declarative
AutopilotRuleCustom Resources (autopilot.libopenstorage.org/v1alpha1), platform and SRE teams can enforce global storage management policies once across thousands of workloads, eliminating manual storage request tickets and operational overhead.
VII. Summary & Final Thoughts
Building a modern, enterprise-grade data platform on Kubernetes requires moving far beyond basic cloud-managed disks. Through this hands-on setup and failover lab, we demonstrated how Portworx abstracts raw, unformatted node storage (/dev/sdb) into a highly available, self-healing, and intelligent software-defined storage fabric.
Key Architectural Takeaways
- Unified Block Storage Virtualization: Portworx consolidates local block devices across worker nodes into a single, high-performance distributed storage pool within the Kubernetes control plane.
- Per-Volume Synchronous Replication (RPO = 0): Utilizing out-of-the-box storage profiles like
px-csi-dbensures that application writes are synchronously mirrored across multiple worker nodes in real time, guaranteeing zero data loss when hardware fails. - Sub-Minute Failover (Low RTO): When a physical node crashes, Kubernetes reschedules stateful workloads like MySQL onto a healthy node. Portworx instantly attaches the pre-existing local block replica, completely eliminating slow cloud-provider disk detachment cycles.
- Autonomous Operations via Autopilot: By continuously evaluating real-time Prometheus telemetry, Portworx Autopilot dynamically expands volumes and filesystems online with zero application downtime, preventing out-of-disk database crashes before they happen.
“Stateless pods are like goldfish—they die, forget their troubles, and move on. Stateful databases have memory, baggage, and severe trust issues. Without Portworx, a node crash is a 3 AM career threat; with Portworx, it’s just a non-event you quietly read about in Slack while sipping your morning coffee.”